
Introduction
In this project, I’ll be working with data from the CIA World Factbook, a collection of statistics about all of the countries on Earth. The factbook contains demographic information like:
- population – The population as of 2015.
- population growth – The annual population growth rate, as a percentage.
- area – The total land and water area.
I’ll be using pandas to run SQL queries and display the results neatly as a DataFrame object.
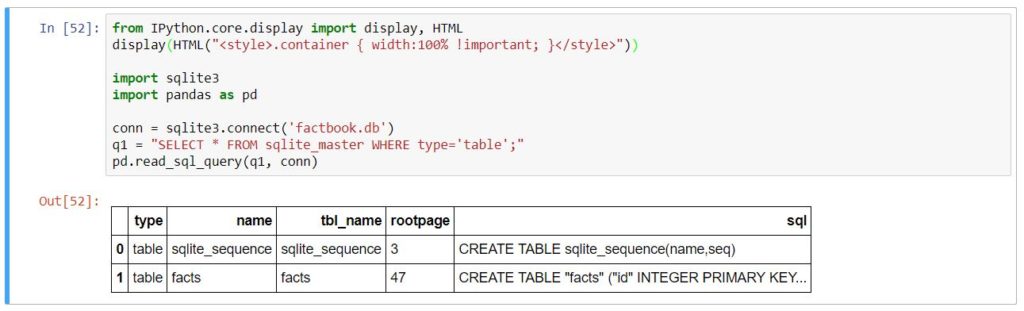
We first begin by importing pandas and sqlite3. Then run a query on the database to return information on the tables in the database.
Run another query that returns the first 5 rows of the facts table in the database.
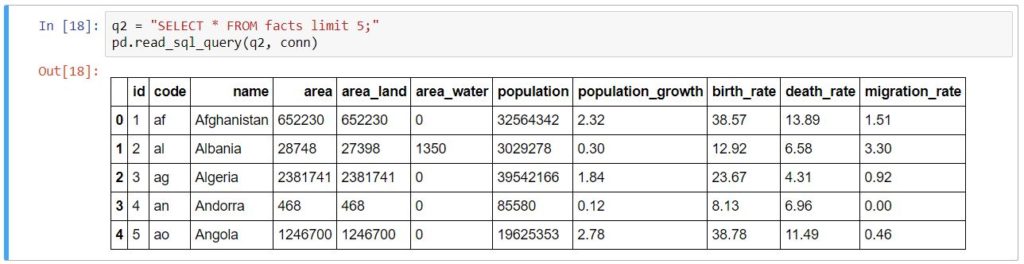
From this table, we see the following information:
- name – The name of the country.
- area – The total land and sea area of the country.
- population – The country’s population.
- population_growth – The country’s population growth as a percentage.
- birth_rate – The country’s birth rate, or the number of births a year per 1,000 people.
- death_rate – The country’s death rate, or the number of death a year per 1,000 people.
- area – The country’s total area (both land and water).
- area_land – The country’s land area in square kilometers.
- area_water – The country’s water area in square kilometers.
Summary Statistics
Let’s calculate a few summary statistics to find any outlier countries. We’ll check the minimum population, max population, minimum population growth, and maximum population growth.

Outliers
We see a couple things that stick out from our summary statistics above.
- There’s a country with 0 population
- There’s a country with a population of 7256490011 (that’s more than 7.2 billion people)
Let’s look into these countries.
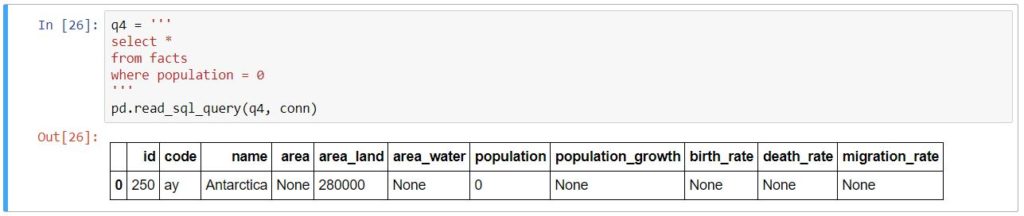
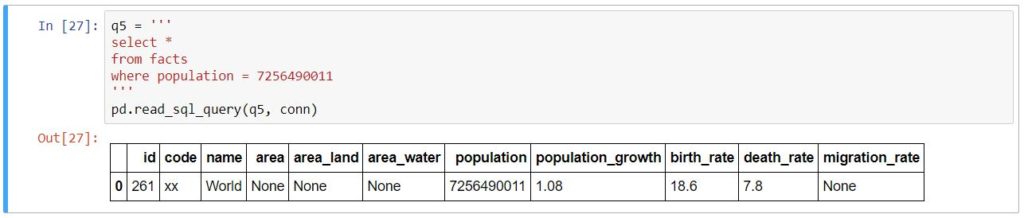
We see above that the population of 0 is for Antarctica, which makes sense. The population of 7256490011 actually refers to the population of the whole world, which explains the amount over 7.2 billion.
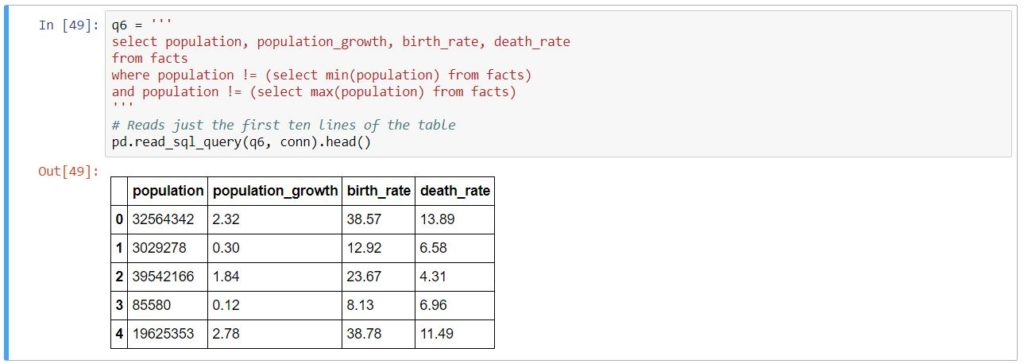
Histograms
Now let’s move on to generating histograms for the rest of the countries in the table to get a visual idea of how the population, population growth, birth rate, and death rate compare to each other. The two outlier rows will be excluded.

Findings
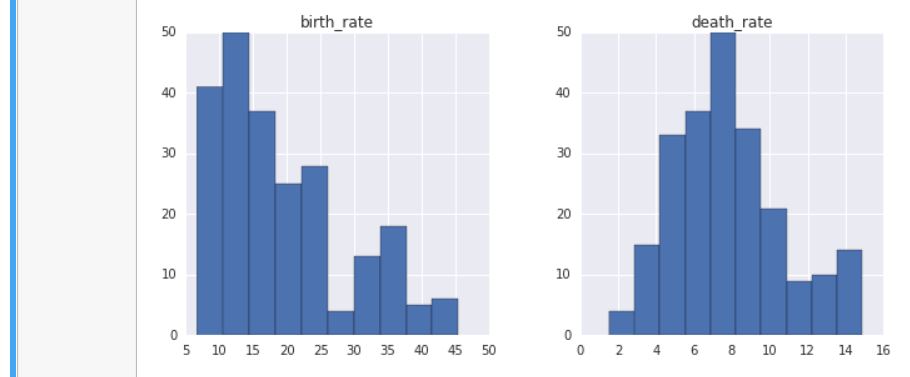
Here are some of the findings from looking at the histograms:
- For the birth rate, the 10-15% range occurred the most. The 25-30% range occurred the least.
- For the death rate, 7-8% seemed to be the average
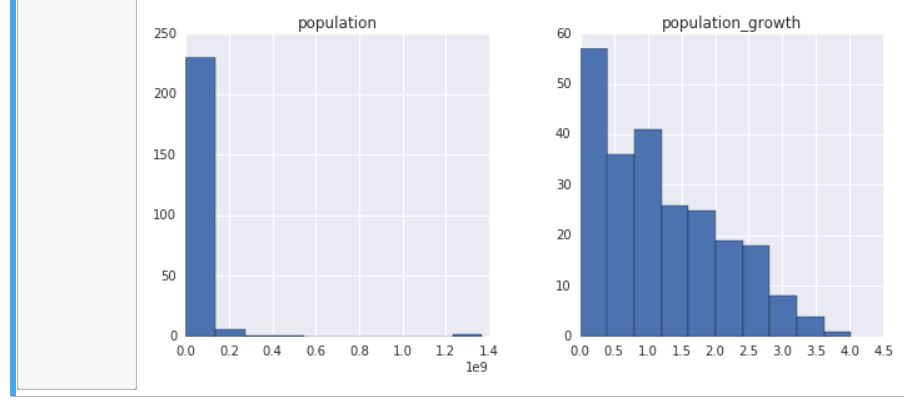
- For population, most countries have a population less than 100,000,000. However, one country has a population around 1.3 billion, which is most likely China.
- For population growth, a rate under 0.5% occurred the most.